Which number do you believe: the one showing Comfort home prices dropped by nearly a third, or the one showing them jumped by double digits in a single month? Both come from real, current data. Neither one is wrong. That is exactly the problem if you are trying to price a home, write an offer, or decide whether Comfort belongs on your shortlist next to Boerne or Fair Oaks Ranch.
Pull up market data on Comfort, Texas right now and you will find numbers that flatly disagree with each other. One widely used portal shows the median sale price over the three months ending April 2026 at $365,000, down 32.1% from the same period the year before. Another data source shows the average home price in the same zip code climbing from $924,702 in August 2026 to $1,058,864 in September 2026, a jump of more than 14% in thirty days. A third shows the median estimated home value sitting at $570,602, with recent sales ranging anywhere from roughly $204,000 to nearly $3.95 million.
None of these sources made an error. Comfort is small enough that its housing market behaves less like a market and more like a handful of individual transactions that happen to get averaged together. Understanding why matters if you are comparing what your money buys here against what it buys thirty minutes away in Boerne.
Two Reports, Same Town, Different Story
Here is what the disagreement looks like laid out side by side.
| Source | Time Window | What It Reported |
|---|---|---|
| Median sale price | Three months ending April 2026 | $365,000, down 32.1% year over year |
| Average home price, 78013 | August 2026 | $924,702 |
| Average home price, 78013 | September 2026 | $1,058,864 |
| Median estimated value | Trailing year | $570,602 |
| Recently sold range | Trailing year | Roughly $203,690 to $3,949,282 |
If you only saw the first row, you would assume Comfort is in a genuine downturn. If you only saw the third and fourth rows, you would assume the opposite. Both readings are technically accurate for the window they cover. Neither one tells you what a typical Comfort home is actually worth this month, because in a market this size, there is no typical month.
Why Thirty-Nine Sales A Year Can't Hold A Straight Line
Comfort is a town of roughly 2,200 residents, small enough to rank outside the top 600 communities in Texas by population. Real estate tracking site RealtyTrac counted 39 total residential transactions over the trailing year in Comfort. That is not 39 sales a month. That is 39 sales, total, for the entire year.
Do the math on what that means for a median. In a market like San Antonio, where thousands of homes close every month, one $4 million estate sale gets absorbed into the data without moving the needle. In Comfort, one $4 million sale can single-handedly drag the average up by six figures, and one month with three modest infill homes closing instead of one riverfront estate can drag it right back down. A median or average calculated from three or four closings in a given month is not a market signal. It is closer to a coin flip that happened to land on real dollar amounts.
This is the mechanism behind the contradiction in the table above. The 32% year-over-year decline and the 14% month-over-month increase are not describing two different markets. They are describing the same small pool of closings, viewed through two different narrow windows, each one small enough that whichever handful of homes happened to close during it can swing the number by a wide margin.
One Listing Explains The Whole Pattern
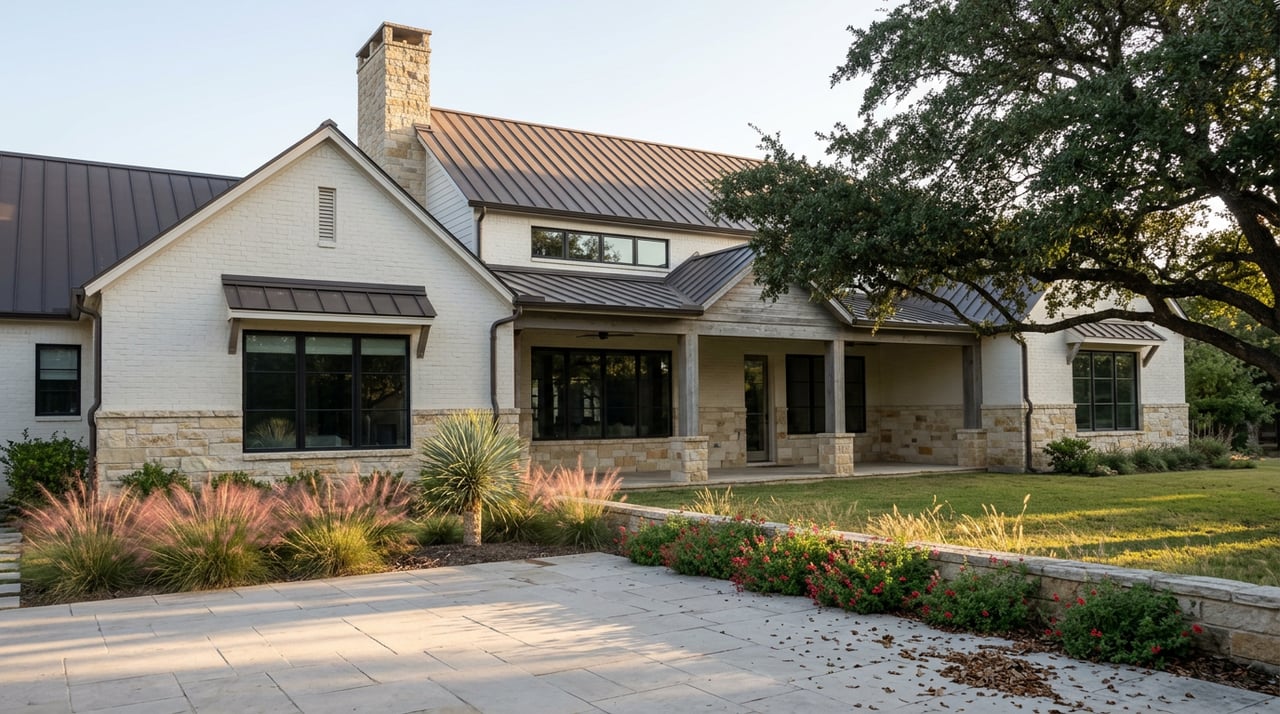
To see how much a single transaction can move these numbers, consider a property that was on the market earlier this year: a 4,012-square-foot home on 12.5 acres along the Guadalupe River, listed at $3.795 million, with 342 feet of private river frontage and a dock. Homes like this exist in Comfort alongside a 1,740-square-foot house on Cypress Creek Road listed under $325,000 and a 1,608-square-foot home on Madrone Ridge listed near $549,000.
Put any one of those into a monthly closing pool of three or four transactions and watch what happens to the average. A single riverfront estate closing in September instead of August is enough, on its own, to explain most of the swing between the two average-price figures above. This is not a flaw in the data. It is what happens when you calculate an average from a small enough sample that individual homes, rather than broad buyer behavior, drive the outcome.
Three Very Different Housing Products Under One Zip Code
Part of why Comfort's numbers scatter so widely is that the town is not selling one type of home. It is selling at least three distinct products that happen to share a zip code.
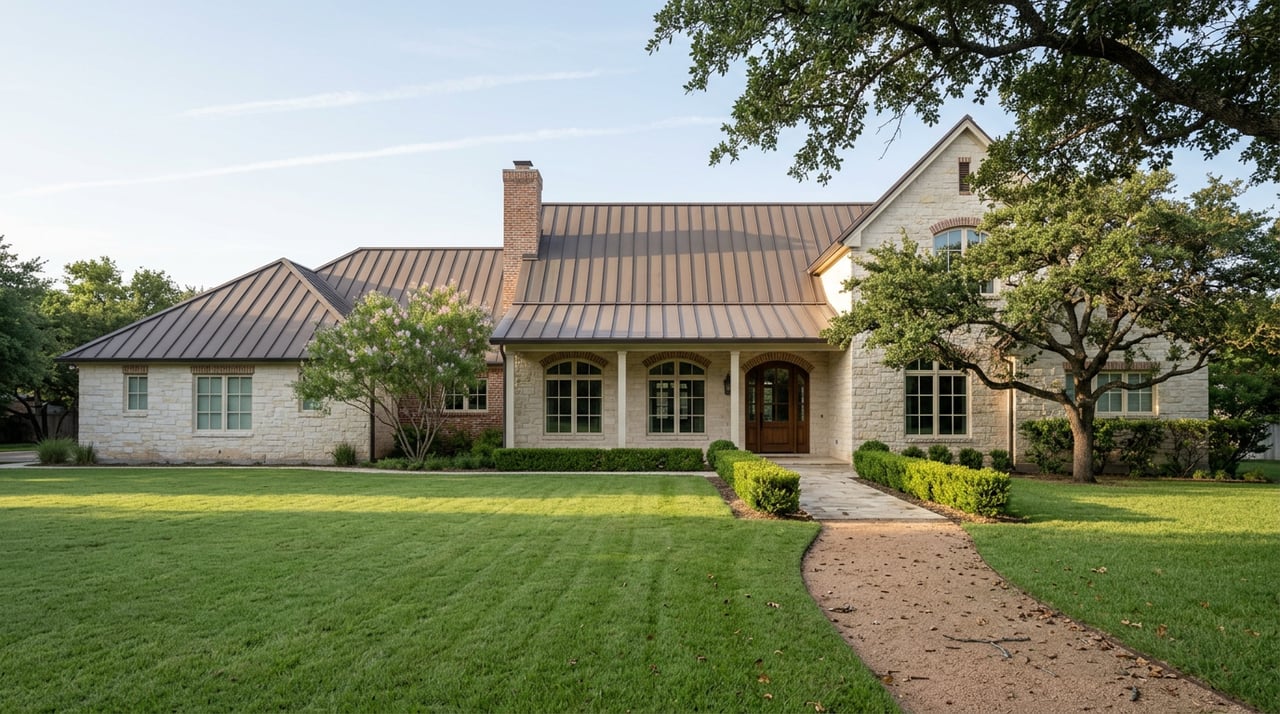
Downtown, along the historic High Street corridor, you find century-old stone buildings and remodeled homes built as far back as 1878, several currently marketed for commercial or mixed residential use. A few miles out, gated riverfront communities like ClearWater Ranches and Falling Water sell acreage tracts along the Guadalupe River, several acres at a time, often with seller financing options attached. Separately, production-style neighborhoods like Hidden Springs and The Ranches at Joshua Creek Crossing offer newer-construction family homes on standard lots.
Averaging the sale price of a downtown commercial building on High Street, a 17-acre river lot at ClearWater Ranches, and a spec home in Hidden Springs into one number produces a figure that describes none of them accurately. If you are comparing Comfort to Boerne or Fair Oaks Ranch, the more useful question is not "what is Comfort's median price" but "what is Comfort's median price for the specific product I'm comparing." A historic High Street property and a Cordillera Ranch estate in Boerne are not competing for the same buyer, and neither should be flattened into the same citywide average.
What Actually Held Steady
While the price figures bounce around, one number in the Comfort data has stayed consistent and is arguably more useful: homes were selling in around 19 days as of the window ending April 2026, with the typical home selling for about 2% below list price. That kind of tight, consistent timeline is a genuine demand signal in a way that a volatile median is not. Homes that sit for months signal a market working through excess inventory. Homes that move in about three weeks, even in a town this small, signal buyers who already know what they want and act quickly when it shows up.
If you are trying to read the temperature of the Comfort market, days on market and the gap between list and sale price tell you more than the median ever will, precisely because they are less sensitive to which specific homes happened to close in a given month.
What This Means If You're Comparing Comfort To Boerne Or Fair Oaks Ranch
This same pattern shows up, in a milder form, in bigger markets nearby. Boerne's median sale price over the three months ending May 2026 was $450,000, down 5.5% year over year, while the average Boerne home price over a more recent single month was reported up 27.9% year over year. That is the identical phenomenon: a shift in which homes sold, not a straightforward move in value, just less extreme because Boerne's monthly sales volume is larger than Comfort's.
The lesson scales down as the town gets smaller. If you are cross-shopping Comfort against Boerne or Fair Oaks Ranch on price alone, a single median or average from any one of these towns is a weak comparison tool on its own. A better approach is to look at price per square foot within a specific product type, hold the days-on-market and sale-to-list figures alongside it, and treat any single median as a data point to investigate rather than a conclusion to act on.
A Few Questions Worth Asking Before You Trust A Comfort Price Number
Did the reported price cover closings or list prices? Some of the widest gaps in Comfort data come from comparing what sellers asked for against what buyers actually paid, which are two different measurements often mistaken for the same thing.
How many homes actually sold in that window? If a source does not tell you the sample size behind a median or average, ask before you rely on it. A number built from three sales carries a different kind of confidence than one built from three hundred.
Does the comparison hold the housing product constant? A riverfront acreage tract, a downtown historic home, and a production-built house on a quarter acre are different assets. Comparing across them under one town-wide price tag will always produce a misleading picture.
Ready To Look Past The Headline Number?
Comfort's price data will keep bouncing around for the same reason it always has: it is a small town with a small number of annual closings, and that is unlikely to change. What can change is how you read it. If you are weighing Comfort against Boerne, Fair Oaks Ranch, or another Hill Country town, the conversation worth having is about the specific street, the specific product type, and the specific comparable sales, not the headline percentage a portal happened to calculate this month.
Samantha Zamora works across Comfort and the greater Hill Country every week and can walk you through what a given price actually reflects before you make an offer or set a listing price. Schedule a Free Consultation to talk through the numbers that actually apply to your situation.